
Collect logs from Windows DNS Server
Windows DNS Server is a server role that functions as the Global Catalog server for the forest and domain in Active Directory. Proper DNS logging is essential for effective security monitoring.
NXLog Agent can collect Windows DNS Server logs from various sources, including ETW providers, file-based DNS debug logs, Sysmon DNS query logs, and Windows Event Log DNS event sources. NXLog Agent also supports passive monitoring of DNS-related network traffic.
NXLog Agent’s log parsing capabilities make it easy to aggregate and normalize DNS logs from different sources and send them to a SIEM for further analysis.
Windows DNS logging overview
NXLog Agent can collect the following DNS logs generated by Windows DNS Server and its clients:
The table below maps key features and attributes unique to each NXLog Agent logging facility available for Windows DNS logging and monitoring.
| DNS Logging or Tracing Type | Provider or Channel | Module(s) | Feature(s) | Requirements |
|---|---|---|---|---|
Audit and Analytical |
Microsoft-Windows-DNSServer |
Preferred method. |
Windows Server 2012 R2 and later |
|
Debug |
Fast. |
Windows Server 2008 R2 and later |
||
Debug |
Fast. |
Windows Server 2008 R2 and later |
||
Active Directory auditing |
Microsoft-Windows-Security-Auditing |
Systems without native DNS auditing |
Windows 8.1 and later |
|
Native DNS auditing |
Microsoft-Windows-DNSServer/Audit |
Preferred method for collecting DNS audit logs |
Windows Server 2012 R2 with hotfix 2956577 and later |
|
Sysmon |
Microsoft-Windows-Sysmon/Operational |
Only DNS client query logging, but it is the only way to obtain the name and path of the client application executing the query. |
Windows 8.1 and later |
|
DNS Client |
Microsoft-Windows-DNS-Client/Operational |
Another source of DNS client query logging. |
Windows 8.1 and later |
DNS logging via ETW providers
Enhanced Windows DNS Event Log logging is available from Event Tracing for Windows (ETW) providers. There are two event categories:
-
Windows DNS Server audit events are switched on by default. An audit event is logged whenever the DNS Server settings, zones, or resource records are changed. Such DNS events are of utmost importance for security audits. Each audit event type is identified by a unique
EventIDdocumented in Microsoft’s Audit events. TheTypecolumn in this table contains a short description of the event; however, it is not included in the actual logged event. For example, if a new zone is created, it is impossible to search for an event that containsRecord create. Instead, only the event ID,515in this case, is available to identify the event type. -
Windows DNS Server analytical events must be explicitly switched on. They represent the bulk of DNS events, primarily lookups and other queries. Microsoft’s Analytic events table lists the event types. Like with audit events, Windows logs the
EventID, but not the more descriptiveTypefield.
Event tracing offers significant advantages over DNS debug logging in terms of architecture, flexibility, ease of configuration, and performance. ETW events can be read directly without having to be written to disk first. However, ETW is not available on older Windows systems. To maintain its performance, it is a "best effort" framework and does not guarantee capturing all events.
For more information, see Enable analytical event logging in the Microsoft documentation.
NXLog Agent provides the Event Tracing for Windows input module to collect DNS logs from the Microsoft-Windows-DNSServer ETW provider.
This is the preferred method for collecting logs from Windows Server 2012 R2 (hotfix 2956577) and later.
This configuration uses the Event Tracing for Windows input module to collect DNS logs from the Microsoft-Windows-DNSServer provider.
It then converts the logs to JSON using the to_json() procedure provided by the JSON extension.
<Extension json>
    Module      xm_json
</Extension>

<Input dns_server>
    Module      im_etw
    Provider    Microsoft-Windows-DNSServer
    Exec        to_json();
</Input>{
"SourceName": "Microsoft-Windows-DNSServer",
"ProviderGuid": "{EB79061A-A566-4698-9119-3ED2807060E7}",
"EventID": 515,
"Version": 0,
"ChannelID": 17,
"Channel": "Microsoft-Windows-DNS-Server/Audit ",
"LevelValue": 4,
"Level": "Information ",
"OpcodeValue": 0,
"TaskValue": 5,
"Category": "ZONE_OP ",
"Keywords": "4611686018428436480",
"EventTime": "2026-04-11T01:47:37.147446-07:00",
"ExecutionProcessID": 4752,
"ExecutionThreadID": 1732,
"EventType": "INFO",
"SeverityValue": 2,
"Severity": "INFO",
"Hostname": "DNS-SRV01",
"Domain": "EXAMPLE",
"AccountName": "Administrator",
"UserID": "S-1-5-21-915329490-2962477901-227355065-500",
"AccountType": "User",
"Flags": "EXTENDED_INFO|IS_64_BIT_HEADER|PROCESSOR_INDEX (577)",
"Type": "1",
"NAME": "test.example.com",
"TTL": "3600",
"RDATA": "0x0A00020F",
"Zone": "example.com",
"ZoneScope": "Default",
"VirtualizationID": ".",
"EventReceivedTime": "2026-04-11T01:47:38.192312-07:00",
"SourceModuleName": "dns_server",
"SourceModuleType": "im_etw"
}File-based DNS debug logging
The DNS debug log provides detailed information on all DNS requests sent and received by the DNS server. This is the only means of monitoring DNS events before Windows Server 2012 R2. However, this feature is still available on newer Windows Server versions and can be used for troubleshooting.
Configure DNS debug logging
Follow these steps to switch on DNS debug logging:
-
Open the DNS Management console (
dnsmgmt.msc). -
Right-click the DNS Server and choose Properties.
-
Switch to the Debug Logging tab and select Log packets for debugging.
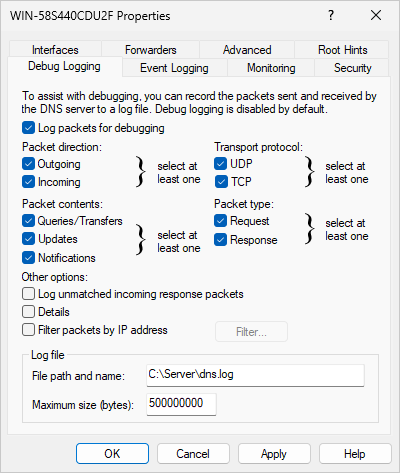 Figure 1. DNS Server Properties window
 -
Select the checkboxes corresponding to the data you want to log.
The Details option produces multiline logs. Refer to Parse detailed DNS debug logs for how to parse this format.
-
Set the File path and name to the location you want to save the log file.
The Windows DNS service may not recreate the debug log file after a rollover.
If you encounter this issue, use the C: drive for the debug log path.
For a detailed explanation, see The disappearing Windows DNS debug log on the NXLog blog.
|
Parse non-detailed DNS debug logs
NXLog Agent can collect Windows DNS Server debug logs using the File input module, and then parse them with the Microsoft DNS Server extension.
This configuration collects Windows DNS Server logs. For demonstration purposes, it converts the events to JSON format using the JSON extension.
<Extension json>
    Module        xm_json
</Extension>

<Extension dns_parser>
    Module        xm_msdns
</Extension>

<Input dns_logs>
    Module        im_file
    File          'C:\Server\dns.log'
    InputType     dns_parser (1)
    Exec          to_json();
</Input>| 1 | Sets the InputType to the xm_msdns instance name. This configuration discards any lines that it cannot parse. Watch out for the DateFormat and try using the parse_msdns() procedure instead if you don’t see any results. |
The following is a Windows DNS log sample, logged in standard debug mode, one query per line.
4/11/2026 7:52:03 AM 06B0 PACKET 00000000028657F0 UDP Snd 10.2.0.1 6590 R Q [8081 DR NOERROR] A (7)example(3)com(0)The following is the same record after NXLog Agent processed it.
{
  "EventTime": "2026-04-11T07:52:03.000000-07:00",
  "ThreadId": "06B0",
  "Context": "PACKET",
  "InternalPacketIdentifier": "00000000028657F0",
  "Protocol": "UDP",
  "SendReceiveIndicator": "Snd",
  "RemoteIP": "10.2.0.1",
  "Xid": "6590",
  "QueryResponseIndicator": "Response",
  "Opcode": "Standard Query",
  "FlagsHex": "8081",
  "RecursionDesired": true,
  "RecursionAvailable": true,
  "ResponseCode": "NOERROR",
  "QuestionType": "A",
  "QuestionName": "example.com",
  "EventReceivedTime": "2026-04-11T07:52:03.811991-07:00",
  "SourceModuleName": "dns_logs",
  "SourceModuleType": "im_file",
  "Hostname": "DNS-SRV01"
}
Parse detailed DNS debug logs
NXLog Agent can parse detailed DNS debug logging with the Multiline Parser extension and regular expressions.
This configuration collects detailed Windows DNS Server logs. It uses two regular expressions, one to parse the event header and another to parse the event into structured data. For demonstration purposes, it converts the events to JSON format using the JSON extension.
define EVENT_REGEX     /(?x)(?<Date>\d+(?:\/\d+){2})\s \
                       (?<Time>\d+(?:\:\d+){2}\s\w+)\s \
                       (?<ThreadId>\w+)\s+ \
                       (?<Context>\w+)\s+ \
                       (?<InternalPacketIdentifier>[[:xdigit:]]+)\s+ \
                       (?<Protocol>\w+)\s+ \
                       (?<SendReceiveIndicator>\w+)\s \
                       (?<RemoteIP>[[:xdigit:].:]+)\s+ \
                       (?<Xid>[[:xdigit:]]+)\s \
                       (?<QueryType>\s|R)\s \
                       (?<Opcode>[A-Z]|\?)\s \
                       (?<QFlags>\[(.*?)\])\s+ \
                       (?<QuestionType>\w+)\s+ \
                       (?<QuestionName>.*)\s+  \
                       (?<LogInfo>.+)\s+.+=\s \
                       (?<Socket>\d+)\s+ Remote\s+ addr\s \
                       (?<RemoteAddr>.+),\sport\s \
                       (?<PortNum>\d+)\s+Time\sQuery= \
                       (?<TimeQuery>\d+),\sQueued= \
                       (?<Queued>\d+),\sExpire= \
                       (?<Expire>\d+)\s+.+\( \
                       (?<BufLen>\d+)\)\s+.+\( \
                       (?<MsgLen>\d+)\)\s+Message:\s+ \
                       (?<Message>(?s).*)/

define HEADER_REGEX    /(?x)(?<Date>\d+(?:\/\d+){2})\s \
                       (?<Time>\d+(?:\:\d+){2}\s\w+)\s \
                       (?<ThreadId>\w+)\s+ \
                       (?<Context>\w+)\s+ \
                       (?<InternalPacketIdentifier>[[:xdigit:]]+)\s+ \
                       (?<Protocol>\w+)\s+ \
                       (?<SendReceiveIndicator>\w+)\s \
                       (?<RemoteIP>[[:xdigit:].:]+)\s+ \
                       (?<Xid>[[:xdigit:]]+)\s \
                       (?<QueryType>\s|R)\s \
                       (?<Opcode>[A-Z]|\?)\s \
                       (?<QFlags>\[(.*?)\])\s+ \
                       (?<QuestionType>\w+)\s+ \
                       (?<QuestionName>.*)/

<Extension json>
    Module        xm_json
</Extension>

<Extension multiline>
    Module        xm_multiline
    HeaderLine    %HEADER_REGEX%
</Extension>

<Input dns_logs>
    Module        im_file
    File          'C:\Server\dns.log'
    InputType     multiline (1)
    <Exec>
        if $raw_event =~ %EVENT_REGEX%
        {
            $EventTime  = parsedate($Date + " " + $Time);
            delete($Date);
            delete($Time);
            to_json();
        }
    </Exec>
</Input>| 1 | Sets the InputType to the xm_multiline instance name. |
The following is a Windows DNS debug log sample, logged in detailed mode.
4/11/2026 8:33:36 AM 09B8 PACKET  0000022041EED460 UDP Rcv 192.168.56.1    edaa   Q [2001   D   NOERROR] A      (6)example(3)com(0)
UDP question info at 0000022041EED460
  Socket = 680
  Remote addr 192.168.56.1, port 48210
  Time Query=6941, Queued=0, Expire=0
  Buf length = 0x0fa0 (4000)
  Msg length = 0x0027 (39)
  Message:
    XID       0xedaa
    Flags     0x0120
      QR        0 (QUESTION)
      OPCODE    0 (QUERY)
      AA        0
      TC        0
      RD        1
      RA        0
      Z         0
      CD        0
      AD        1
      RCODE     0 (NOERROR)
The following is the same record after NXLog Agent processed it.
{
  "BufLen": "512",
  "Context": "PACKET",
  "Expire": "0",
  "InternalPacketIdentifier": "000000D58F45A560",
  "LogInfo": "UDP response info at 000000D58F45A560",
  "Message": "XID       0x000d\r\n    Flags     0x8180\r\n      QR        1 (RESPONSE)\r\n      OPCODE    0 (QUERY)\r\n      AA        0\r\n      TC        0\r\n      RD        1\r\n      RA        1\r\n      Z         0\r\n      CD        0\r\n      AD        0\r\n      RCODE     0 (NOERROR)\r\n    QCOUNT    1\r\n    ACOUNT    1\r\n    NSCOUNT   0\r\n    ARCOUNT   0\r\n    QUESTION SECTION:\r\n    Offset = 0x000c, RR count = 0\r\n    Name      \"(6)example(3)com(0)\"\r\n      QTYPE   AAAA (28)\r\n      QCLASS  1\r\n    ANSWER SECTION:\r\n    Offset = 0x001c, RR count = 0\r\n    Name      \"[C00C](6)example(3)com(0)\"\r\n      TYPE   AAAA  (28)\r\n      CLASS  1\r\n      TTL    26\r\n      DLEN   16\r\n      DATA   2a00:1450:400d:805::200e\r\n    AUTHORITY SECTION:\r\n      empty\r\n    ADDITIONAL SECTION:\r\n      empty\r\n",
  "MsgLen": "56",
  "Opcode": "Q",
  "PortNum": "60010",
  "Protocol": "UDP",
  "QFlags": "[8081   DR  NOERROR]",
  "QueryType": "R",
  "QuestionName": "(6)example(3)com(0)",
  "QuestionType": "AAAA",
  "Queued": "0",
  "RemoteAddr": "::1",
  "RemoteIP": "::1",
  "SendReceiveIndicator": "Snd",
  "Socket": "512",
  "ThreadId": "044C",
  "TimeQuery": "12131",
  "Xid": "000d",
  "EventTime": "2026-04-11T08:33:36.000000-07:00",
  "EventReceivedTime": "2026-04-11T08:33:38.660127-07:00",
  "SourceModuleName": "dns_logs",
  "SourceModuleType": "im_file",
  "Hostname": "DNS-SRV01"
}
Sysmon DNS query logs
Sysmon is a Windows system service and device driver that monitors system activity and records events to the Windows Event Log. Unlike other DNS logging methods, Sysmon DNS query logging (Event ID 22) captures only client-side queries and uniquely records the name and path of the application that initiated each query. This information is not available from DNS Server Audit, Analytical, or debug logging.
Sysmon can track DNS queries from any Windows client software, such as web browsers, FTP clients, ping, or tracert.
However, it does not capture lookups made by nslookup.
For setup instructions, see Setting up Sysmon.
Configure DNS query logging
Sysmon does not log DNS client queries by default.
To switch on DNS query logging, create a Sysmon configuration file in the same directory as Sysmon.exe:
<Sysmon schemaversion="4.91">
  <EventFiltering>
    <DnsQuery onmatch="exclude"/>
  </EventFiltering>
</Sysmon>
Then, run the following command to apply the new configuration:
C:\Windows> Sysmon.exe -c config-dnsquery.xmlRun the following command to verify that the new configuration is applied:
C:\Windows> Sysmon.exe -cThe last few lines of the Sysmon output should confirm that DNS Query logging is active:
Rule configuration (version 4.91):
- DnsQuery onmatch: exclude combine rules using 'And'| A good resource for configuring Sysmon to log DNS events is the sysmon-config GitHub repository. The sysmonconfig-export.xml file contains a DNS section with a description of the configuration. |
Once Sysmon is active and running as a service, it will log various events, including DNS queries. You can find the events in Windows Event Viewer under Applications and Services Log > Microsoft > Windows > Sysmon > Operational. Each event has an associated event ID. For example, Sysmon event ID 22 is generated when a process issues a DNS query. The telemetry for this event was added in Windows 8.1 and is not available in earlier versions. See our Sysmon integration guide for more information.
Sysmon creates an ETW trace session to collect DNS events and write them to Windows Event Log. You can collect these events with the Event Log for Windows input module. However, you can also collect the logs directly from the DNS providers using the Event Tracing for Windows input module to minimize computational overhead.
This configuration collects Sysmon DNS query events from the Microsoft-Windows-Sysmon/Operational channel.
For demonstration purposes, it converts the events to JSON format using the JSON extension.
<Extension json>
    Module    xm_json
</Extension>

<Input sysmon>
    Module    im_msvistalog
    <QueryXML>
        <QueryList>
            <Query Id="0">
                <Select Path="Microsoft-Windows-Sysmon/Operational">
                    *[System[(EventID='22')]]
                </Select>
            </Query>
        </QueryList>
    </QueryXML>
    Exec      to_json();
</Input>
The following is a Sysmon DNS query event resulting from a ping after NXLog Agent processed it.
{
  "EventTime": "2026-04-13T01:18:57.328706-07:00",
  "Hostname": "DNS-SRV01.nx.local",
  "Keywords": "0x8000000000000000",
  "LevelValue": 4,
  "EventType": "INFO",
  "SeverityValue": 2,
  "Severity": "INFO",
  "EventID": 22,
  "SourceName": "Microsoft-Windows-Sysmon",
  "ProviderGuid": "{5770385F-C22A-43E0-BF4C-06F5698FFBD9}",
  "Version": 5,
  "TaskValue": 22,
  "OpcodeValue": 0,
  "RecordNumber": 5853,
  "ExecutionProcessID": 2824,
  "ExecutionThreadID": 6380,
  "Channel": "Microsoft-Windows-Sysmon/Operational",
  "Domain": "NT AUTHORITY",
  "AccountName": "SYSTEM",
  "UserID": "S-1-5-18",
  "AccountType": "User",
  "Message": "Dns query:\r\nRuleName: -\r\nUtcTime: 2026-04-13 08:18:56.306\r\nProcessGuid: {4F93DAE8-A6F0-69DC-DF07-000000001000}\r\nProcessId: 5608\r\nQueryName: example.com\r\nQueryStatus: 0\r\nQueryResults: ::ffff:93.184.216.34\r\nImage: C:\\Windows\\System32\\PING.EXE\r\nUser: NX\\Administrator",
  "Category": "Dns query (rule: DnsQuery)",
  "Opcode": "Info",
  "Level": "Information",
  "RuleName": "-",
  "UtcTime": "2026-04-13 08:18:56.306",
  "ProcessGuid": "{4F93DAE8-A6F0-69DC-DF07-000000001000}",
  "ProcessId": 5608,
  "QueryName": "example.com",
  "QueryStatus": "9701",
  "QueryResults": "-",
  "Image": "C:\\Windows\\System32\\PING.EXE",
  "User": "NX\\Administrator",
  "EventReceivedTime": "2026-04-13T01:18:58.649070-07:00",
  "SourceModuleName": "sysmon",
  "SourceModuleType": "im_msvistalog"
}
Summary of DNS query fields
The fields of particular interest are QueryName and Image, which provide information about the client machine’s network activity.
From these fields, you can identify which site was queried and which application was accessing that remote site.
The Message field usually contains a long string of information, which NXLog Agent parses into the following fields:
-
UtcTime(used to createEventTime) -
ProcessGuid -
ProcessId -
QueryName(the FQDN being looked up) -
QueryStatus -
QueryResults -
Image(the full path and filename of the client application performing the DNS query)
Windows Event Log DNS sources
The Event Log for Windows input module can capture almost any Windows event type. For example, you can use it to collect DNS Server audit events, DNS client events from Sysmon, and native DNS client events with a single configuration.
Collect native DNS client logs
You can collect DNS client logs on Windows from the Microsoft-Windows-DNS-Client/Operational channel.
This configuration uses the Event Log for Windows input module to collect DNS client events. For demonstration purposes, it converts the events to JSON format using the JSON extension.
<Extension json>
    Module    xm_json
</Extension>

<Input dns_client>
    Module    im_msvistalog
    <QueryXML> (1)
        <QueryList>
            <Query Id="0">
                <Select Path="Microsoft-Windows-DNS-Client/Operational">
                    *[System[(EventID=3006 or EventID=3008 or
                              EventID=3010 or EventID=3018)]]
                </Select>
            </Query>
        </QueryList>
    </QueryXML>
    <Exec>
        if ($QueryName == 'wpad') OR ($QueryType != 1) { (2)
            drop();
        }
        to_json();
    </Exec>
</Input>| 1 | The QueryXML block filters for select event IDs. |
| 2 | Drops events related to queries for wpad and query types other than 1. |
{
  "EventTime": "2026-04-13T02:10:45.880342-07:00",
  "Hostname": "DNS-SRV01.nx.local",
  "Keywords": "0x8000000000000000",
  "LevelValue": 4,
  "EventType": "INFO",
  "SeverityValue": 2,
  "Severity": "INFO",
  "EventID": 3006,
  "SourceName": "Microsoft-Windows-DNS-Client",
  "ProviderGuid": "{1C95126E-7EEA-49A9-A3FE-A378B03DDB4D}",
  "Version": 0,
  "TaskValue": 0,
  "OpcodeValue": 0,
  "RecordNumber": 583,
  "ExecutionProcessID": 2584,
  "ExecutionThreadID": 3340,
  "Channel": "Microsoft-Windows-DNS-Client/Operational",
  "Domain": "NT AUTHORITY",
  "AccountName": "SYSTEM",
  "UserID": "S-1-5-18",
  "AccountType": "User",
  "Message": "DNS query is called for the name WIN-58S440CDU2F.nx.local, type 1, query options 720575941453045760, Server List , isNetwork query 0, network index 0, interface index 0, is asynchronous query 0",
  "Opcode": "Info",
  "Level": "Information",
  "QueryName": "WIN-58S440CDU2F.nx.local",
  "QueryType": 1,
  "QueryOptions": 720575941453045800,
  "ServerList": "",
  "IsNetworkQuery": 0,
  "NetworkQueryIndex": 0,
  "InterfaceIndex": 0,
  "IsAsyncQuery": 0,
  "EventReceivedTime": "2026-04-13T02:10:47.664522-07:00",
  "SourceModuleName": "dns_client",
  "SourceModuleType": "im_msvistalog"
}
Collect DNS Server audit logs
Both the Event Log for Windows and Event Tracing for Windows input modules can collect DNS Server audit events. We recommend using the latter when performance is a concern.
This configuration uses the Event Log for Windows input module to collect DNS audit events from the Microsoft-Windows-DNSServer/Audit channel.
It collects all audit events since most are important, and audit logs tend to be much lower in volume than analytical or debug logs.
For demonstration purposes, it converts the events to JSON format using the JSON extension.
<Extension json>
    Module    xm_json
</Extension>

<Input dns_audit>
    Module    im_msvistalog
    <QueryXML>
        <QueryList>
            <Query Id="0">
                <Select Path="Microsoft-Windows-DNSServer/Audit">*</Select>
            </Query>
        </QueryList>
    </QueryXML>
    Exec      to_json();
</Input>{
"EventTime": "2026-04-13T02:31:09.509441-07:00",
"Hostname": "DNS-SRV01.nx.local",
"Keywords": "0x4000000000100000",
"LevelValue": 4,
"EventType": "INFO",
"SeverityValue": 2,
"Severity": "INFO",
"EventID": 515,
"SourceName": "Microsoft-Windows-DNSServer",
"ProviderGuid": "{EB79061A-A566-4698-9119-3ED2807060E7}",
"Version": 0,
"TaskValue": 5,
"OpcodeValue": 0,
"RecordNumber": 73,
"ExecutionProcessID": 2716,
"ExecutionThreadID": 7064,
"Channel": "Microsoft-Windows-DNSServer/Audit",
"Domain": "NX",
"AccountName": "Administrator",
"UserID": "S-1-5-21-3612079828-4028589534-2533769062-500",
"AccountType": "User",
"Message": "A resource record of type 1, name test.nx.local, TTL 3600 and RDATA c0a80064 was created in scope Default of zone nx.local. [virtualization instance: .].",
"Category": "ZONE_OP",
"Opcode": "Info",
"Level": "Information",
"Type": 1,
"NAME": "test.nx.local",
"TTL": 3600,
"BufferSize": 4,
"RDATA": "c0a80064",
"Zone": "nx.local",
"ZoneScope": "Default",
"VirtualizationID": ".",
"EventReceivedTime": "2026-04-13T02:31:10.733161-07:00",
"SourceModuleName": "dns_audit",
"SourceModuleType": "im_msvistalog"
}Collect DNS Server analytical logs
You can use the Event Log for Windows input module to read DNS Server Analytical logs from files using the File directive. The format of archived DNS Server Analytical log files differs by Windows Server version:
-
Windows Server 2016 and earlier: Analytical logs are stored in
.etl(Event Trace Log) format. -
Windows Server 2019 and later: Analytical logs are stored in
.evtxformat.
The active log file is located at %SystemRoot%\System32\winevt\Logs\Microsoft-Windows-DNSServer%4Analytical.evtx.
Because the Event Log for Windows input module cannot seek in these log files, it reads the file from the beginning each time NXLog Agent restarts. This method is only suitable for processing archived event files and not for monitoring the active log. For active analytical log monitoring on any Windows Server version, we recommend collecting logs via ETW providers.
This configuration uses the Event Log for Windows input module to collect DNS analytical events from a file. For demonstration purposes, it converts the events to JSON format using the JSON extension.
<Extension json>
    Module    xm_json
</Extension>

<Input dns_analytical>
    Module    im_msvistalog
    File      'C:\temp\Microsoft-Windows-DNSServer-Analytical.evtx'
    <Exec> (1)
        if ($QNAME == 'americas1.notify.windows.com.akadns.net.') OR \
           ($QNAME == 'cy2.vortex.data.microsoft.com.akadns.net.') OR \
           ($QNAME == 'dm3p.wns.notify.windows.com.akadns.net.') OR \
           ($QNAME == 'geo.vortex.data.microsoft.com.akadns.net.') OR \
           ($QNAME == 'v10-win.vortex.data.microsoft.com.akadns.net.') OR \
           ($QNAME == 'v10-win.vortex.data.microsoft.com.akadns.NET.') OR \
           ($QNAME == 'v10.vortex-win.data.microsoft.com.') OR \
           ($QNAME == 'wns.notify.windows.com.akadns.net.') OR \
           ($QNAME == 'wns.notify.windows.com.akadns.NET.') OR \
           ($QNAME == 'client.wns.windows.com.') OR \
           ($QTYPE == '15') {
            drop();
        }
        to_json();
    </Exec>
</Input>| 1 | Filters out hosts that are not relevant for security monitoring. |
{
  "EventTime": "2026-04-13T03:06:07.698425-07:00",
  "Hostname": "DNS-SRV01.nx.local",
  "Keywords": "0x8000000800000000",
  "LevelValue": 4,
  "EventType": "INFO",
  "SeverityValue": 2,
  "Severity": "INFO",
  "EventID": 279,
  "SourceName": "Microsoft-Windows-DNSServer",
  "ProviderGuid": "{EB79061A-A566-4698-9119-3ED2807060E7}",
  "Version": 0,
  "TaskValue": 1,
  "OpcodeValue": 0,
  "RecordNumber": 50,
  "ExecutionProcessID": 2716,
  "ExecutionThreadID": 3628,
  "Channel": null,
  "Message": "INTERNAL_LOOKUP_CNAME: TCP=0; InterfaceIP=::1; Source=::1; RD=1; QNAME=test.nx.local.; QTYPE=6; Port=51411; Flags=34176; XID=3710; PacketData=0e7e858000010001000000002466636232326439332d333533312d343163642d616433312d643162663865633965616532065f6d73646373026e78056c6f63616c0000060001; GUID={BC98F20B-E670-46B3-B977-F379D54CDF5C}",
  "Category": "LOOK_UP",
  "Opcode": "Info",
  "Level": "Information",
  "TCP": 0,
  "InterfaceIP": "::1",
  "Source": "::1",
  "RD": 1,
  "QNAME": "test.nx.local.",
  "QTYPE": 6,
  "Port": 51411,
  "Flags": 34176,
  "XID": 3710,
  "BufferSize": 70,
  "PacketData": "0e7e858000010001000000002466636232326439332d333533312d343163642d616433312d643162663865633965616532065f6d73646373026e78056c6f63616c0000060001",
  "GUID": "{BC98F20B-E670-46B3-B977-F379D54CDF5C}",
  "EventReceivedTime": "2026-04-13T03:21:25.307733-07:00",
  "SourceModuleName": "dns_analytical",
  "SourceModuleType": "im_msvistalog"
}